
Kenya’s economic crisis is not just the much touted Debt to GDP ratio

The real problem with Kenya’s debt crisis is that it continues to spiral out of control, while the country’s leadership sings songs of “it’s for development” and “it’s not that bad”! When a country is struggling to pay it’s wage bill, let alone it’s development expenditure, you know you’re in Banana Republic territory. The country has borrowed more in the 5 years since 2013 than it did in the 50 years between 1963 and 2013; even in real terms. All this being done in the name of “infrastructure development”, economic growth and driving the country to middle income status.
But, we need to look at the real picture. We don’t often consider revenue management on a macro scale, but the principles are similar. Selling the right product, to the right person, at the right place, at the right price on a micro scale translates to income “flows” on a national scale. The inflows into a country, in a fiscal year versus the outflows. To analyse Kenya’s debt crisis from a revenue management perspective on a macro-scale would probably fry our brains, so let’s take a more conventional approach.
The conventional wisdom from many experts, that has been bucked by the government, is that a debt-GDP ratio for Kenya above the 40% benchmark, is unsustainable! In the midst of Kenya’s debt crisis, we see two battling sides of the argument.
Some of the arguments being bandied about by government politicians are:
- We are taking on debt to invest in infrastructure that will drive future exponential economic growth.
- Many of the world’s leading economies have debt-GDP ratios much higher than Kenya’s, so our situation is not bad at all.
- Kenya’s debt-GDP ratio is actually only 48% and will be at 44% by end 2018.
The truth:
- As of 2018, Kenya is broke – https://citizentv.co.ke/news/treasury-kenya-is-broke-192961/
- Few are looking at the deficit-GDP ratio alongside the absolute debt, and Kenya’s ability to repay her debt.
Based on the country’s current economic performance, there is no evidence that the heavy borrowing is boosting economic growth. In fact, there is more anecdotal and much documented evidence that much of these funds have been misappropriated, rather than invested.
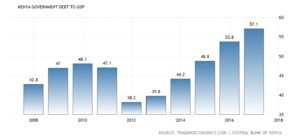
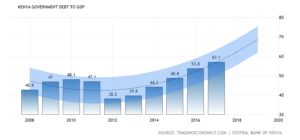
Debt-GDP forecasts and global comparisons
As Kenya sinks deeper in the mire, the country;s “leadership” continues to incur more debt. Alongside this deepening debt, GDP growth is stagnating, making the situation worse (an analysis for a different story). The trajectory is for the debt-GDP ratio to grow to close to 70% by 2020.
In 2018, even as the debt-GDP ratio approached 60% Kenya was still approaching China for additional loans. The appetite for debt continued unabated, despite all signs that it must be better managed.
So, having debunked two of the arguments of the leadership, regarding the real debt-GDP ratio and debt driving economic growth, let’s look at their comparative claims.
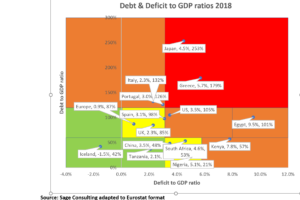
Arguments against Kenya’s debt crisis often quote the debt-GDP ratios of the world’s leading economies. The medium-term trends of the debt-GDP ratios of the world’s leading economies are:
- US: 105%.
- Japan: 253%.
- Europe: 87%.
- China: 48%.
- Kenya: 57%
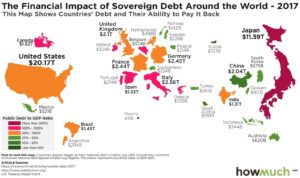
From these statistics, it looks like Kenya’s leadership may have a point…until you look a the full picture.
To digress for a minute, you will note from this global map that size matters, although not for the reasons you’d think. Whereas the United States and Japan stand out on the map, they have the ability to hold such high levels of debt for reasons unique to them. The United States, being the world’s most dominant economy generates the required revenue and has demonstrated that it can apply the correct fiscal policy to prevent their national debt from becoming catastrophic in the long term. Japan’s debt meanwhile is not foreign debt but mainly domestic debt that can be directly controlled by government.
Deficit-GDP ratios
Debt-GDP ratios are only part of the story when you evaluate any country’s debt situation. We observe the trend of Kenya’s deficit growth, that continues to be a challenge with no clear indicators of a reduction in the medium-term.
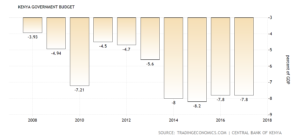
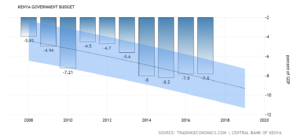
Kenya’s voracious appetite for debt began with the Jubilee government and introduction of County governments under devolution in 2013/2014, and shows no signs of abating.
The below trend of deficit growth continues to be a challenge with no clear indicators of a reduction in the medium-term.
When we look at the previously referenced key economies with high debt-GDP ratios against their deficit-GDP ratios it’s a different story. In layman’s terms, these figures essentially represent these governments’ ability to pay their debt – all standing below -5%:
- US: -3.5%.
- Japan: -4.5%.
- Europe: -0.9%.
- China: -3.5%.
- Kenya: -7.8%
But we’ll get back to this later. The simple point is that Kenya is not in a good place for a developing economy, when compared to the world’s leading economies. So the Kenya leadership’s comparative argument is a faulty analogy.
The worst performers in Europe
For us to further probe this comparative argument let us therefore look at Europe’s economic “basket” cases.
Debt-GDP ratio
- Spain: 98%.
- Portugal: 126%
- Italy: 132%
- Greece: 179%.
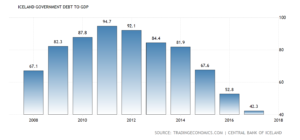
- Iceland: 42%
Deficit-GDP ratio
- Spain -3.1%.
- Portugal: -3.0%
- Italy: -2.3%
- Greece: -5.7%.
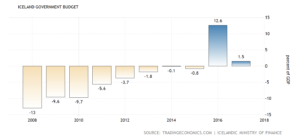
- Iceland: +1.5%
http://www.europarl.europa.eu/RegData/etudes/note/join/2014/528745/IPOL-ECON_NT(2014)528745_EN.pdf
European Economic Union (EEC) rules require adherence to, or a trend towards the 60%/-3% rule. I’d say that this is a pretty good authority for Kenya to be guided by.
All the comparative evidence indicates that Kenya is heading towards technical insolvency, as happened to Greece and Iceland. But at least Iceland learned from their debacle, whereby they are now a model global economic citizen.
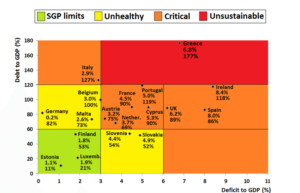
The European Economic Community’s Stability and Growth Pact
The Stability and Growth Pact (SGP) of the EEC is an invaluable guideline for developing countries to adopt for growth. For more conservative growth, reducing this SGP rule by 25% to 45%/ -2.25% would be more prudent…unless the economy in question has a sustainable resource/ technology rich economic engine driver.
The SGP provides guidelines that govern budgetary discipline for EU members with regards to debt and deficits. https://ec.europa.eu/info/business-economy-euro/economic-and-fiscal-policy-coordination/eu-economic-governance-monitoring-prevention-correction/stability-and-growth-pact/legal-basis-stability-and-growth-pact_en
https://commons.wikimedia.org/w/index.php?curid=22861754
Although Iceland is not reflected in this chart, it is instructive to look at their debt-deficit record and recovery in the period since the 2008 global financial crisis, kicked off with their banking crisis.
https://www.economist.com/media/pdf/meltdown-iceland-boyes-e.pdf
Any country should obviously strive to be in the green or yellow zones. Iceland came back from the brink of economic collapse in 2008 and fortunately, through drastic corrective measures has been able to resurrect their economy.
Accordingly, they would have been represented in the orange zone in this chart and been moving in the right direction. Iceland’s trends are represented below.
Borrowing from the EEC’s SGP
Regulation of the type of the SGP is imperative. Ultimately, a lack of regulation leads to financial crises and collapse. We all know the stories of Greece, Iceland and the United States. However, with the exception of Greece, other nations that have been through this predicament have learned from their mistakes and mended their ways.
So, before we get to Kenya, let’s summarise the situation with the most notable countries in the adjacent chart.
- Iceland: Went from economic collapse with extreme deficit levels to being well within the SGP limits, through regulation and austerity measures.
- Greece: Continues to be in ‘unsustainable’ territory despite bailouts and austerity measures. The overexposure to foreign debt has been the albatross around their neck, and their focus on deficit reduction must continue. Without caution and austerity measures now, Kenya is in danger of following the “Greece track”.
https://www.nytimes.com/2018/06/21/business/economy/greece-europe-bailout.html
A comparisons we should stop making, and recovery on our own continent
- Japan: Their debt is different from other countries under consideration, as most of it is domestic debt, largely within government control. The likelihood of default is minimal to non-existent.
- Egypt: Her economic mismanagement has been long-term and just like Kenya, for a long time Egypt had no cogent recovery plan. The IMF-guided recovery and austerity plan now gives a clear roadmap to recovery. Kenya should watch this recovery carefully as it targets both deficit reduction and GDP growth, to mitigate against the high debt ratio, or in other words, makes the high debt level more acceptable.
https://www.imf.org/en/News/Articles/2016/11/11/NA111116-A-Chance-For-Change-Egypt
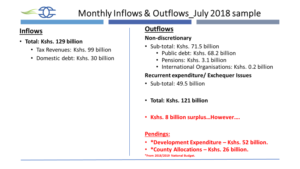
Kenya’s ability to meet fiscal obligations
If the Kenya government income and expenditure statement July 2018 is anything to go by, then the short-term future is looking bleak. The government will be challenged to meet it’s obligations as government revenues are consumed by debt servicing and recurrent expenditure, as well as the expense of national development expenditure and investment in the counties for grassroots development.
Reduction/ elimination of budget deficit
It’s a no brainer that Kenya has four avenues to managing deficit reduction:
- Austerity measures to reign in runaway government expenditure. The budget estimates for the 2018/ 2019 financial year indicate a deficit of US$ 5.9 billion.
- Growth of GDP and government revenues ahead of expenditures.
- Reining in of corruption. It is estimated that Kenya loses 1/3rd of her annual revenues to corruption, at about US$ 6 billion annually. This would plug the whole annual budget deficit. https://www.reuters.com/article/us-kenya-corruption/third-of-kenyan-budget-lost-to-corruption-anti-graft-chief-idUSKCN0WC1H8
- It has been posited that the opaqueness of the Kenya budget facilitates the theft of these funds right from this budget making stage. The Institute of Economic Affairs (IEA-Kenya) in it’s June 2018 Budget Analysis paper has described the budget estimates made available as lacking. These shortfalls include: missing backing documentation for analysis, lack of comprehensive and detailed budget financing information and inconsistencies in budget deficit information.
It is actually not a choice between these 4 levers, but for all 4 to work together. But let’s get real with ourselves.

Option 3 is a dragon that also requires huge political will to slay. It is questionable whether we have this will; from President to man-on-the-street. It has been argued that Kenya’s economy cannot be stable without slaying the dragon of corruption. However, because it is fed down to the most basic unit of our society, it will require drastic action that induces mindset change, e.g., jail a few high profile thieves…for a long, long time!
So, we are left with options 1 and 2 as the immediately available primary levers to fix our deficit.
Option 4 is a hard ask given the financial mess that Kenya is currently in. Rectifying these anomalies and bringing transparency to budget making is actually more of a political than a financial decision, given the populist objectives that drive the allocation of these funds. The leading Kenyan economist and thought-leader David Ndii has revealed Kenya’s publicly issued debt information, from the relevant authorities, to be misleading. This is due to the coming together of this opacity and the endemic culture of corruption and theft.
Austerity measures
So, instead of simply waiting for these longer term measures to be taken, let us focus on the levers for economic correction that are immediately available. It has been widely acknowledged that Kenya is over-represented in the legislature and bloated in the public service, with overconsumption and wastage at every level.
Austerity measures are required in many areas. Based on indications from Treasury and the Executive, these could include:
- The NC-DF, which encompasses the National Constituency Development Fund, managed by members of the National Assembly for each constituency, are a duplication of funds allocated to Counties and are actually unconstitutional. Parliament’s role under the constitution is purely legislation. – saving Kshs. 35.7 billion.
- The annual public sector wage bill across all sectors – National and County governments – is estimated to be Kshs. 650 billion. Recommendations from government studies, bodies such as ICPAK and the President himself are to reduce this by 20%. This would be achieved through a combination of salary cuts at the top levels, hiring restrictions related to natural attrition, and retrenchments.
This will further limit recurrent expenditure to no more than 70% in the split between recurrent and development expenditure. – saving Kshs. 130 billion.
https://www.icpak.com/wp-content/uploads/2015/09/Position-Paper-on-Public-Sector-Wage-Bill.pdf
- Merger of state corporations – saving Kshs. 4 billion. https://www.standardmedia.co.ke/business/article/2001290111/90s-style-imf-backed-austerity-squeeze-looms
- 30% reduction on local and international travel – saving Kshs. 8.4 billion. https://www.nation.co.ke/business/Govt-spending-on-travel-hits-Sh27bn/996-4184328-500b8qz/index.html
- Confirmed freeze on new projects – saving Kshs. 30.1 billion.
- Unconfirmed freeze on a portion of new projects – saving (410 x 30%) Kshs. 123 billion.
- Reduction of allocations to counties – saving Kshs. 18 billion.
Total potential immediate, short-term austerity measure savings – Kshs. 349.2 billion. (And this from a layman. I’m sure our experts could triple or quadruple these savings.)
GDP Growth
Kenya’s GDP growth figures need to be audited and validated as they appear contradictory and inconsistent, both from a trend and comparative basis, across various sources of data.
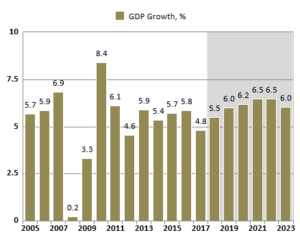
Source: : IMF: World Economic Outlook (WEO) Database, April 2018
Traditionally, Kenya’s GDP declines in the period around and following an election. Whereas 2013/14 GDP growth can be rationalized by the April timing of the election and corresponding launch of devolution and Counties expenditure, the 2017 growth figure featured raises questions.
2017 was characterized by several factors that would logically result in reduced GDP growth:
- Introduction of interest rate caps, reducing liquidity and access to credit for investment in commercial activity.
- The two national elections, being the August general election and October Presidential election re-run.
- The downsizing of media, banking, manufacturing and technology companies; and collapse of banks and retail companies.
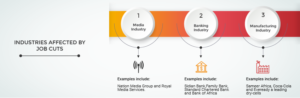
https://www.brightermonday.co.ke/blog/job-cuts-kenya/
- The capital markets losing 5% of their value in a bear market.
- Failures of the sugar and maize sectors, necessitating emergency imports of these products.
- Failure of the Galana-Kulalu irrigation scheme where despite a Kshs. 7 billion debt and displacement of pastoralist communities, only 5,000 acres out of 1,000,000 were planted, necessitating the importation of relief rice to feed the local communities.
The national treasury data indicates that government revenues have stagnated for the last 7 years. By all indications, the revenue collection outlined in the 2018/19 budget estimate is a pipe dream. Leading economists such as David Ndii and Kwame Owino are of the opinion that Kenya is unlikely to generate more than Kshs. 1.4 trillion in government revenue. Based on the original budget estimates this raises the deficit to over Kshs. 1 trillion.
Debt and growth over the medium term
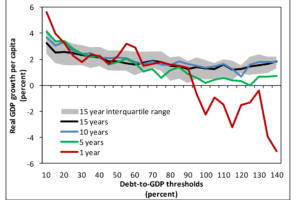
Source: IMF Working Paper WP/14/34
https://www.imf.org/external/pubs/ft/wp/2014/wp1434.pdf
IMF analysis suggests that there is an inverse correlation between debt-to-GDP levels and GDP growth. There is a particularly significant drop-off in GDP growth once the 90% debt-to-GDP threshold is crossed. This inverse effect is particularly pronounced in the short and medium-term, but levels off somewhat in the long-term. This is due to remedial measures and economic adjustments being made in the longer term to either reduce the debt-to-GDP ratio, or if this ratio remains high, to mitigate against it’s effects by managing other levers and economic indicators.
Conclusions
Going back to the 4 levers that we outlined, Kenya’s back is against the wall. However, the answers are clear but it will simply take strong political will and a clear-headed plan to right the ship.
Cons and Pros
Cons:
- Corruption and theft are the bane of Kenya’s economy. Without arresting these two vices, GDP growth will continue to be constrained, at best, and probably decline and continue the economic stagnation.
- The making of the budget is driven by political intent and is thus deliberately opaque. As long as politicians, instead of the economists, determine the composition of the budget it will continue to be a pipe dream and stomping ground for thieves!
- Kenya leadership’s appetite for easy-to-access, but heavily strings-attached debt continues unabated, thus mortgaging the country’s future.
Pros
- The wastage, theft and padding of an unrealistic budget provide a lot of fat to cut from with austerity measures. These will go a long way in alleviating Kenya’s debt crisis.
- The foundation and structure of Kenya’s economy is still intact. Some common sense and sound economic actions should be able to turn things around pretty quickly.
- Sufficient international interest from foreign investors and multi-lateral economic organisations still exists, whereby they are interested in being a part of Kenya’s recovery.
- The economic hardship, particularly on the middle class, brought on by Kenya’s debt crisis has increased political and social discontent, to the point that the country’s leadership can no longer carry on “business as usual”.
The final outtake
The conclusion is simple. The 2010 constitution has failed to make Kenya a constitutional democracy, with 3 evenly balanced arms of government. The country is still a country with a de facto imperial Presidency, that sits on a bully pulpit and gets its way with all institutions, the legislature and even the judiciary.
The President is therefore culpable and accountable, both for the mess of Kenya’s debt crisis, as well as being the one to be held responsible to fix it.
- The President needs to direct his cabinet to enact all the austerity measures post-haste.
- The judiciary needs to be urgently freed, empowered and funded, so that the constitution and the law are consistently applied. This is obviously essential to eradicate the impunity that exists and allows corruption and economic mismanagement to persist.
- Kenya needs to follow the path of countries like Tanzania, Malaysia and Sierra Leone, in rejecting unsustainable China loans and investment.
- Free the countries qualified economists to work with multi-lateral economic organisations to fix the country’s economic fundamentals, arrest the deficit and bring back strong GDP growth; devoid of politics.
- Clamp down on corruption and send a whole bunch of big fish to jail!
This article was originally published in October 2018.
For strategic advisory that will leverage uncommon sense and drive your bottom line, get in touch with us on [email protected]
Follow on:


.png)